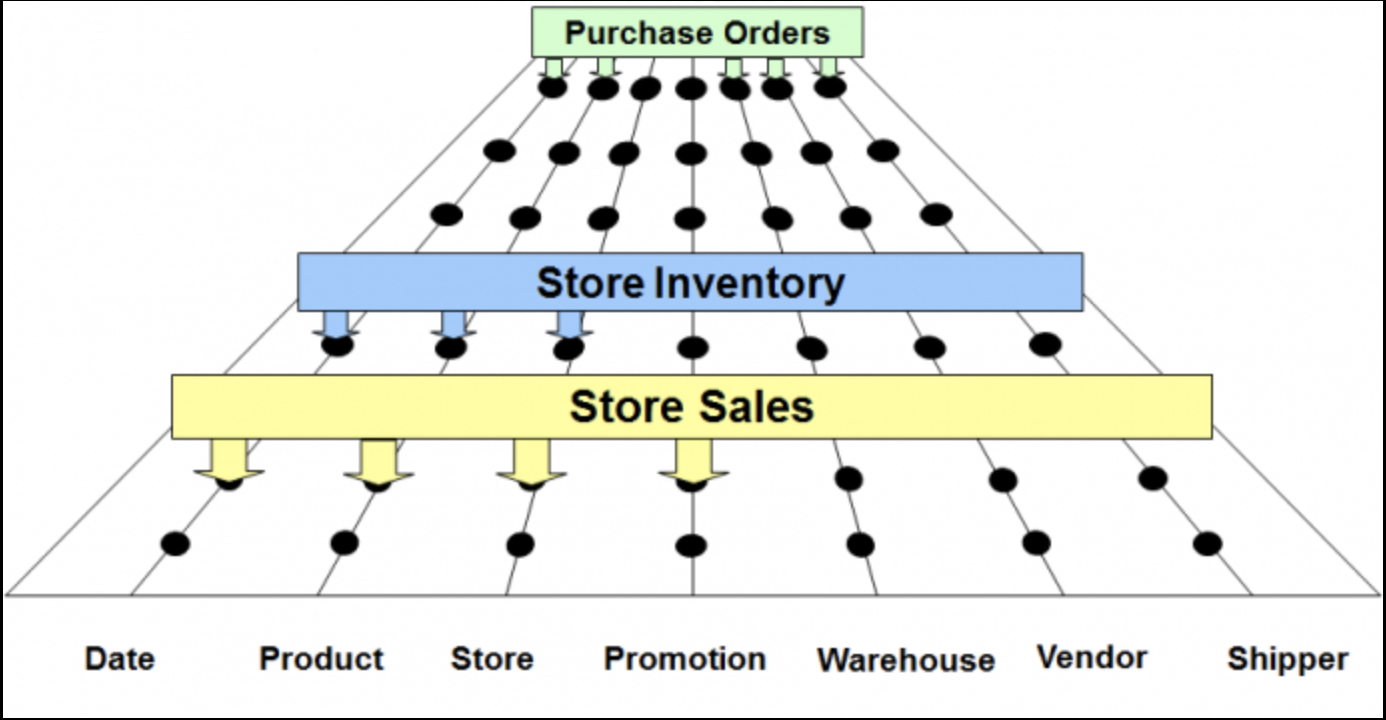
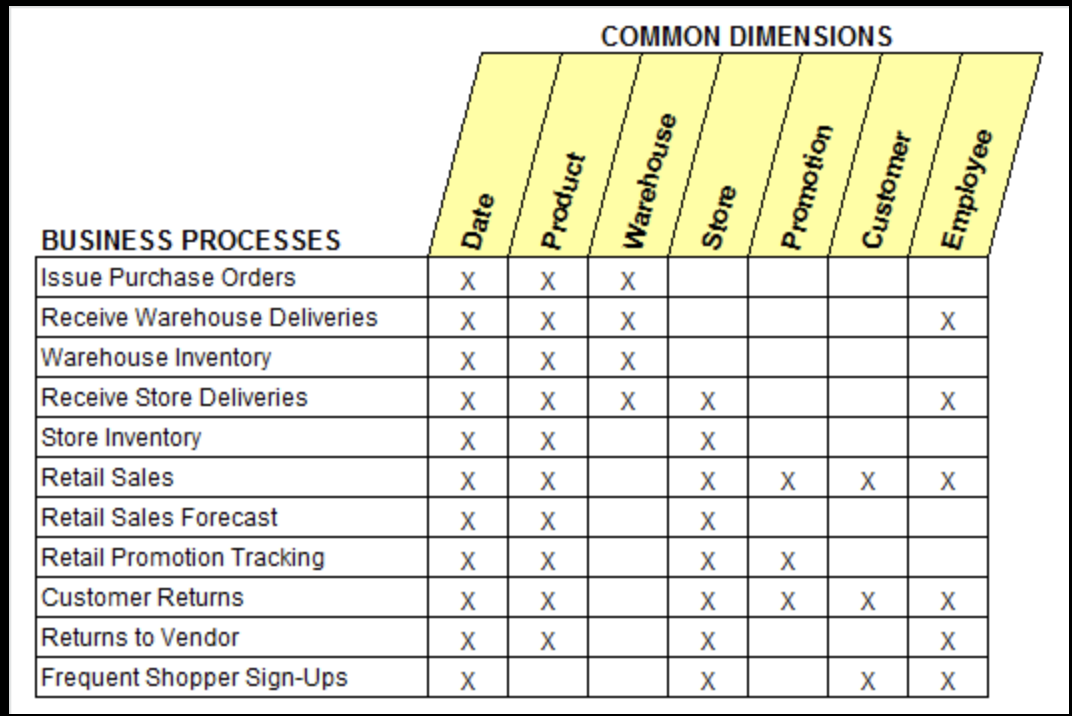
Ralph Kimball's dimensional approach builds a data warehouse incrementally, one business process at a time, while guaranteeing that the pieces fit together. The bus matrix is the tool that makes that guarantee concrete: a single grid that lists every business process as a row, every shared dimension as a column, and marks which dimensions each process uses. This page explains the structure, shows how a row turns into a star schema, demonstrates a drill-across query that only works because dimensions are conformed, and covers the trade-offs and common mistakes.
The Kimball Bus Matrix is a planning and governance artifact used in Kimball Dimensional Architecture. It defines how business processes relate to conformed dimensions across the enterprise.
It serves as the architectural blueprint for building a scalable, integrated dimensional data warehouse.

Business Process | Date | Product | Customer | Store | Promotion
---------------------------------------------------------------
Sales            |  X   |   X     |    X     |   X   |     X
Orders           |  X   |   X     |    X     |   X   |
Shipments        |  X   |   X     |          |   X   |
Inventory        |  X   |   X     |          |   X   |
Returns          |  X   |   X     |    X     |   X   |
The Kimball Bus Matrix defines which conformed dimensions apply to each business process, ensuring scalable, consistent, and integrated dimensional analytics.
Each row is implemented with Kimball's four-step design: choose the business process, declare the grain (the exact meaning of one fact row), identify the dimensions (read straight off the row's Xs), and identify the numeric facts measured at that grain. Declaring the grain before choosing dimensions matters: a fact table at receipt-line grain can carry a product key, but one at daily store-total grain cannot.
A dimension is conformed when every fact table that uses it means exactly the same thing by it: the same keys, the same attribute names, and the same values. Sometimes a process uses a subset of a dimension at a coarser grain (for example monthly budgets against a month-level rollup of the date dimension); a shrunken dimension that is a strict subset of the full one still conforms.
Drilling across means querying two fact tables separately at a common grain and joining the results on conformed attributes. It is the payoff of the bus matrix: because Sales and Shipments both use the same dim_product and dim_date, their totals line up row for row.
WITH sales AS (
    SELECT d.month, p.category, SUM(f.amount) AS sales_amount
    FROM fact_sales f
    JOIN dim_date d    ON f.date_key = d.date_key
    JOIN dim_product p ON f.product_key = p.product_key
    GROUP BY d.month, p.category
),
shipments AS (
    SELECT d.month, p.category, SUM(f.units_shipped) AS units_shipped
    FROM fact_shipments f
    JOIN dim_date d    ON f.date_key = d.date_key
    JOIN dim_product p ON f.product_key = p.product_key
    GROUP BY d.month, p.category
)
SELECT COALESCE(s.month, sh.month)       AS month,
       COALESCE(s.category, sh.category) AS category,
       s.sales_amount,
       sh.units_shipped
FROM sales s
FULL OUTER JOIN shipments sh
  ON s.month = sh.month AND s.category = sh.category
ORDER BY month, category;
Aggregating each fact separately before joining is essential. Joining the two fact tables directly on product and date multiplies rows (a fan-out) and inflates both totals.
| Approach | Integration point | Strengths | Costs |
|---|---|---|---|
| Kimball bus architecture | Conformed dimensions | Incremental delivery, business-friendly stars, fast queries | Requires cross-team agreement on dimensions |
| Inmon corporate information factory | Normalized enterprise warehouse | Single integrated model, flexible for new marts | Large upfront modelling before value is delivered |
| Data Vault | Hubs, links, satellites | Auditability, tolerant of source change | Needs a presentation layer (often Kimball stars) on top |
| One big table per use case | None | Simple for a single dashboard | Duplicated logic, inconsistent numbers across teams |
The bus matrix remains useful even under Data Vault or lakehouse designs, because the presentation layer still needs agreed dimensions and a plan for which processes to deliver first.